
Understanding the forces that shape financial markets is essential for every investor and trader. Among the many gauges of market sentiment, none has captured as much attention as the VIX. Sometimes referred to as the “fear gauge,” the VIX reflects investor expectations about future market turbulence. But what exactly is the VIX, how is it calculated, and why do traders pay such close attention to it? This article explores these questions in depth, offering clarity on market volatility and how it can inform trading strategies.
When volatility rises, it often signals uncertainty or risk aversion. When it calms, confidence and stability tend to return. The VIX does not predict future market returns, but it does provide a snapshot of market psychology. By understanding the mechanics and interpretation of the VIX, traders can make more informed decisions under varying market conditions.
Understanding the VIX
The VIX, short for the Volatility Index, measures expected future volatility in the S&P 500 index over the next 30 days. Unlike many market indicators that track price levels or volume, the VIX reflects sentiment. It captures the premium investors are willing to pay for options that protect against significant price swings. When investors anticipate large market moves, they buy more options for protection, driving up option prices and, consequently, the VIX.
In technical terms, the VIX is calculated from the prices of a wide range of S&P 500 index options. The formula estimates expected volatility by assessing the weighted prices of options across different strike prices. High option prices suggest that market participants expect significant movement in the underlying index.
Although the VIX is based on the S&P 500, its influence extends across global markets. Traders in other asset classes often reference the VIX as a proxy for broader market risk sentiment. Because it responds quickly to news and shifts in investor outlook, the VIX is widely regarded as an important barometer of market stress.
What the VIX Tells Us About Market Conditions
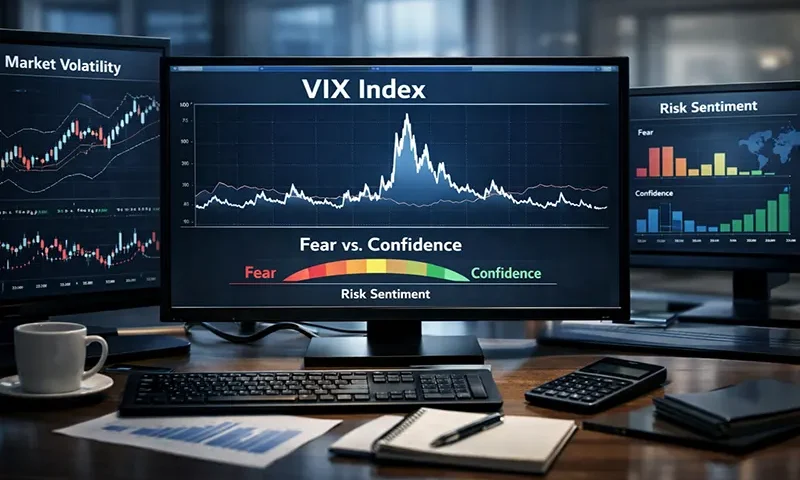
A high VIX reading typically indicates elevated fear or uncertainty. For example, during market downturns or geopolitical crises, the VIX tends to spike as investors rush to hedge their portfolios. Conversely, a low VIX reading suggests complacency and relative calm among market participants.
It is important to recognise that the VIX measures expectations of volatility, not volatility itself. Actual market movements can differ from what is implied by option prices. Nonetheless, the VIX is valuable because it captures collective expectations in a consolidated way. Traders often view rising volatility as a sign that markets may be vulnerable to sharp price changes, while declining volatility may reflect a more stable environment.
Historically, the VIX has shown distinct behaviour during major market events. For example, the VIX surged during the financial crisis of 2008 and again in March 2020 amid the onset of the COVID-19 pandemic. These spikes reflected widespread fear and rapid shifts in investor positioning, even as prices in underlying markets were changing quickly.
How Traders Use the VIX in Practice
Although the VIX itself cannot be traded directly, traders find ways to leverage its signals. One key approach is volatility index trading, which involves using derivative instruments tied to the VIX or volatility more generally. Options and futures contracts on the VIX allow investors to express views on future volatility without directly trading stocks or indices.
For example, during periods when traders expect market turbulence, they might buy VIX futures or options to profit from an anticipated increase in volatility. Conversely, if they believe volatility will subside, they might sell VIX futures or engage in strategies that benefit from stability.
Beyond direct trading, the VIX can inform risk management decisions. Some traders use VIX levels to adjust portfolio exposure. For instance, a sustained rise in the VIX might prompt a reduction in equity positions or the implementation of protective hedges. In contrast, a low VIX reading could support a more aggressive stance.
Misconceptions About the VIX
Despite its widespread use, the VIX is often misunderstood. A common misconception is that a high VIX always predicts a market crash. In reality, elevated volatility can occur in various contexts, including strong upward price movements. Volatility simply reflects the degree of price fluctuation expected by the market — it does not inherently indicate direction.
Similarly, a low VIX does not guarantee a smooth market. Periods of low volatility can be followed by abrupt shocks, especially when markets are complacent. In such times, unexpected news can trigger exaggerated responses precisely because investors are caught off guard.
Another point of confusion concerns the relationship between the VIX and market timing. The VIX offers insight into sentiment, but it should not be used in isolation to make timing decisions. Many successful traders combine VIX readings with other technical and fundamental analyses to build a comprehensive view of market conditions.
Conclusion
The VIX stands as one of the most widely referenced measures of market sentiment. By capturing expectations of volatility through option pricing, it provides a window into how investors collectively view risk. While the VIX does not offer a crystal ball into future price direction, it does highlight shifts in confidence and uncertainty that can influence market behaviour.
